Energy and Emissions

We work to reduce greenhouse gas emissions (GHG) across our operations and value chain through initiatives to minimize energy usage, improve energy efficiency, and increase the energy that we source from renewable power generation. Our emissions reduction efforts are focused on aligning PPG with a 1.5-degrees C future, ensuring that our efforts support the global response to climate change while lowering operating costs and maximizing resource efficiency.
Scope 1 and 2 GHG emissions reduction

Scope 3 GHG emissions reduction

PPG GHG Emissions for 2019 Baseline Year
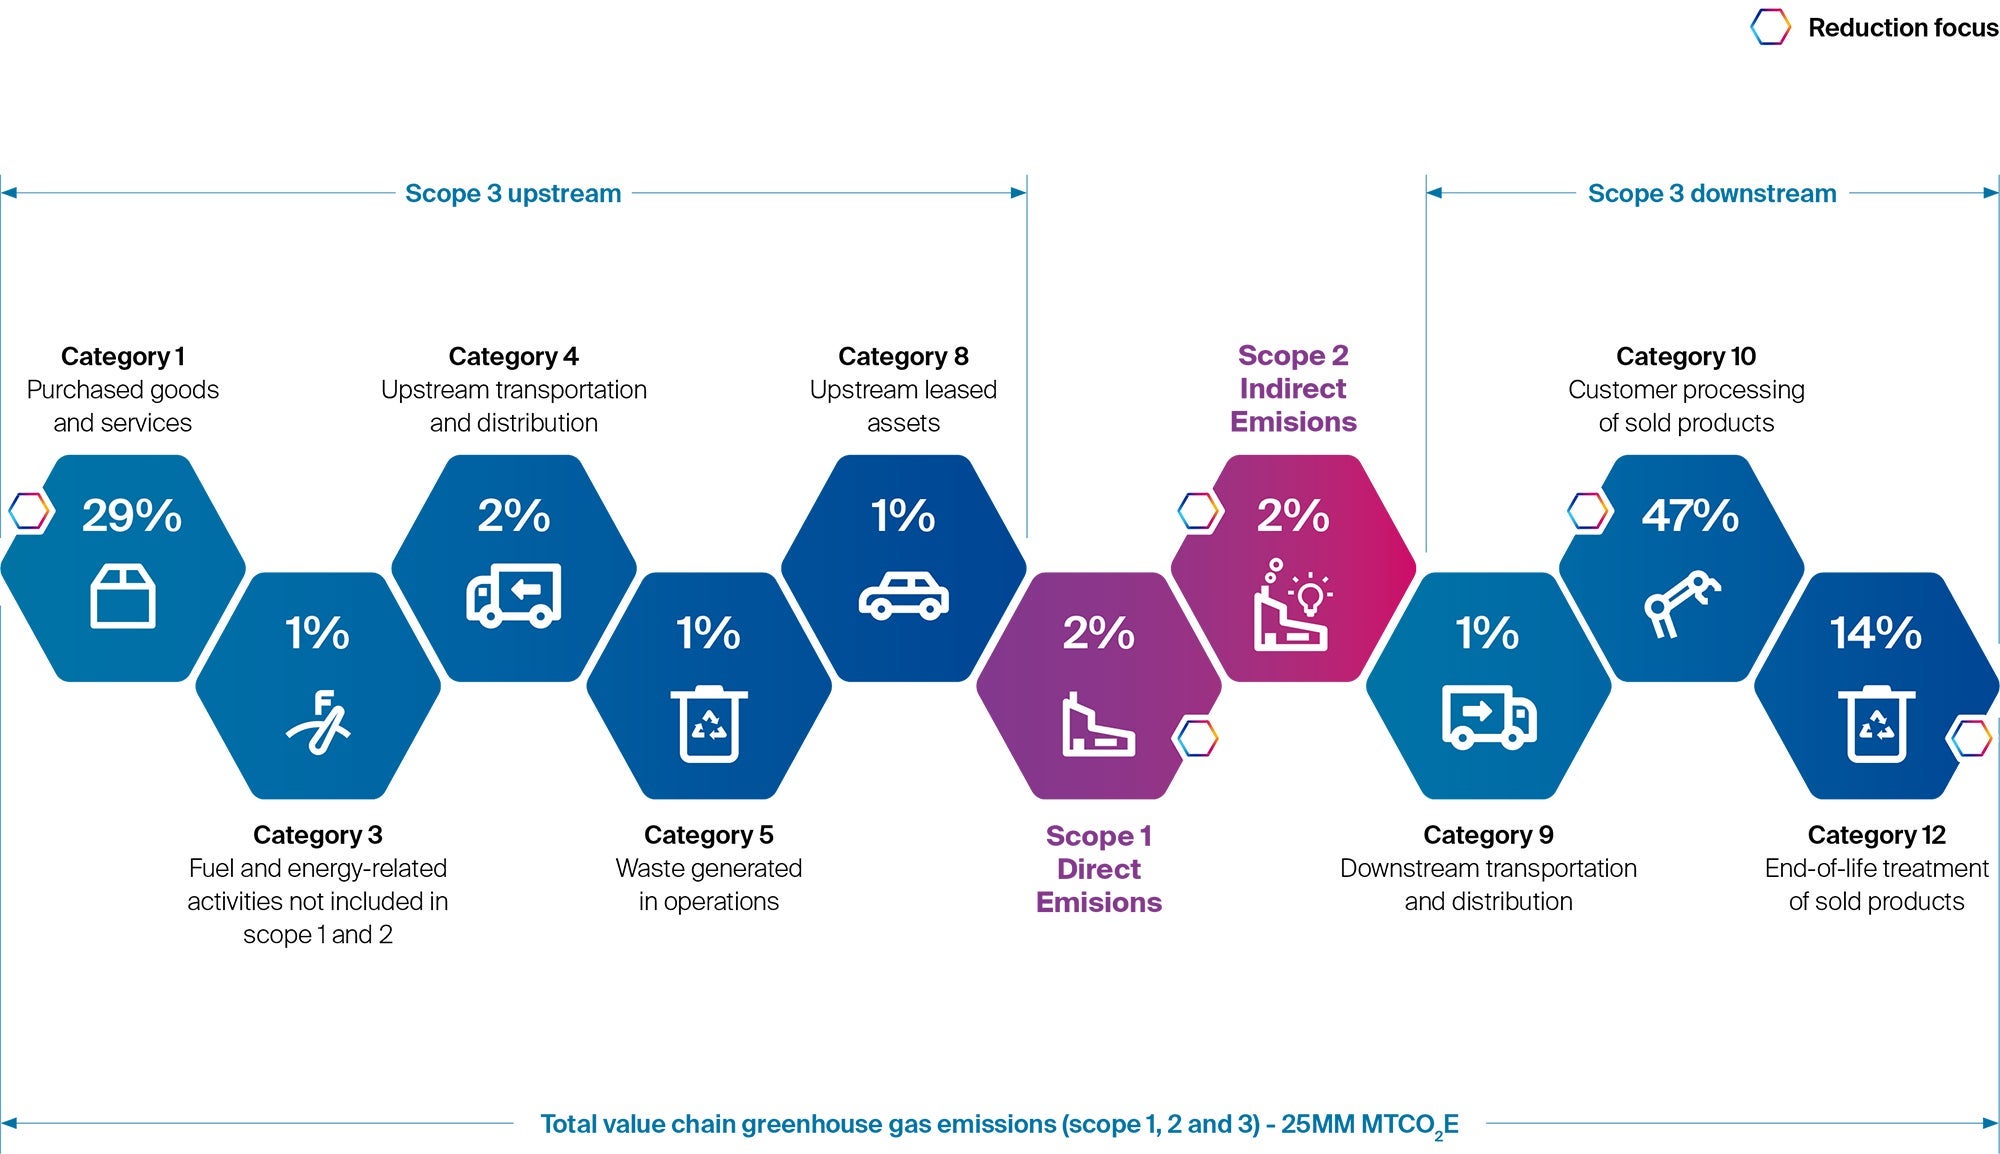
In 2023, we achieved a 10% reduction in absolute direct (scope 1) and indirect (scope 2) GHG emissions from the 2019 baseline. These reductions represent meaningful progress against our company-wide 2030 goal of achieving a 50% reduction in GHG emissions from our own operations (scope 1 and 2 emissions). This target has been validated by the Science Based Targets initiative (SBTi) and aligns PPG's operations with a 1.5 degrees C future. The reduction is primarily due to the greening of the grid, power purchase agreements, and purchasing renewable energy credits.
Following an extensive review of our value chain to identify and measure scope 3 emissions, we also established our first value chain GHG emissions reduction target in 2023. Scope 3 emissions refer to all other indirect emissions an organization is connected to through its upstream and downstream business activities.
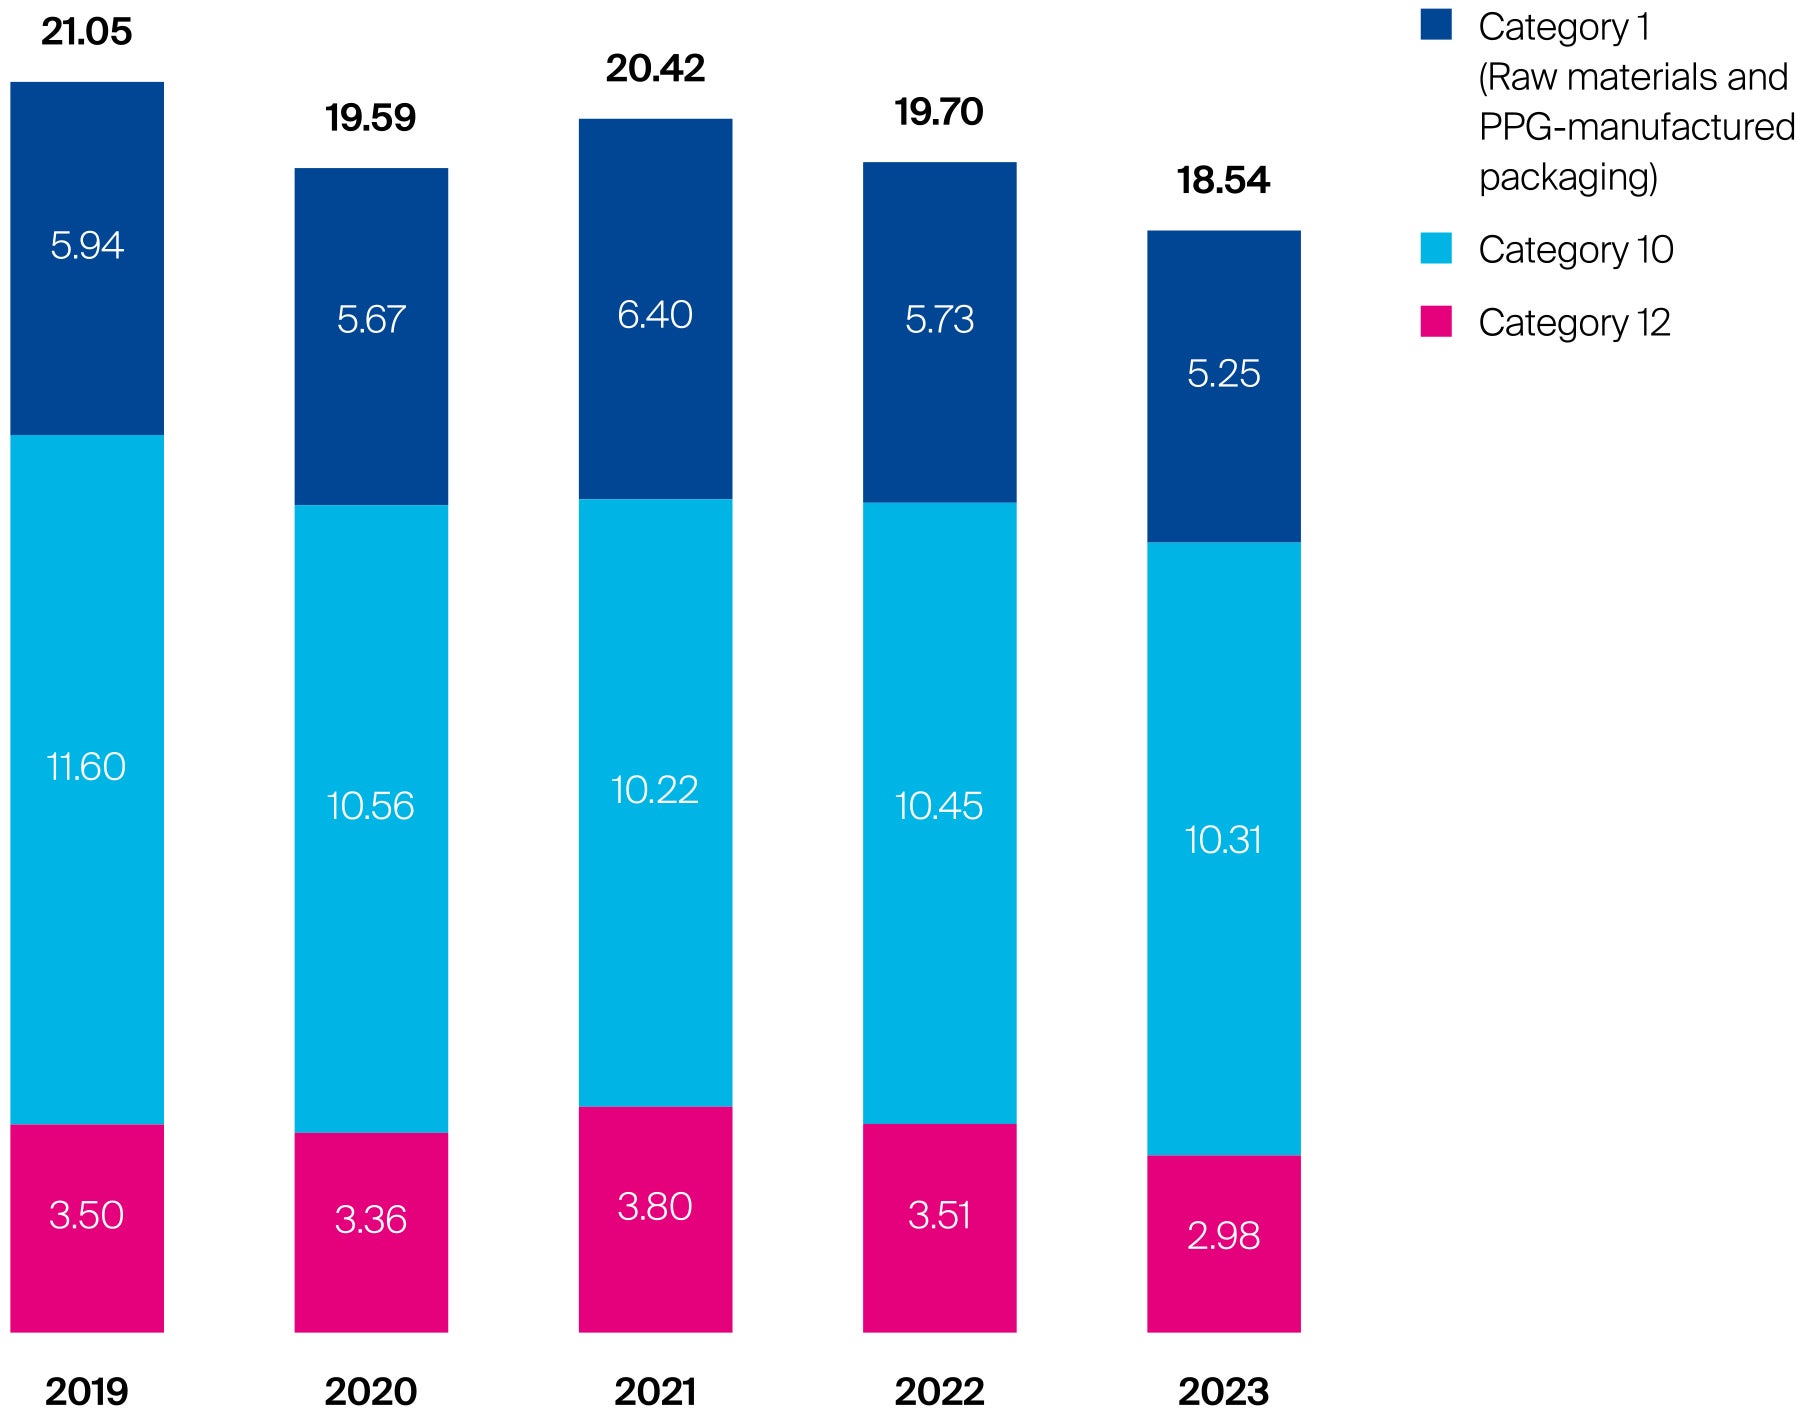
By 2030, we are committed to reducing our absolute scope 3 emissions by 30% from a 2019 baseline across the following categories, as defined by GHG Protocol's Corporate Value Chain (scope 3) Standard:
- Category 1: Purchased goods and services, including raw materials and PPG-manufactured packaging
- Category 10: Customer processing of sold products
- Category 12: End-of-life treatment of sold products
We selected these three categories because they account for more than 80% of our scope 3 emissions and we are positioned to influence reductions in these areas. Our category 1 and 12 emissions are calculated based on the actual substance breakdown of our purchased raw materials and their quantity, instead of the spend based method. PPG has modeled its tens of thousands of raw material substances using literature or database data to improve the accuracy of category 1 and 12 carbon emissions, compared to the spend based method.
In 2023, we saw a 12% reduction in our scope 3 emissions against our baseline year of 2019. The reduction was primarily due to improved data, grid greening benefits across the value chain and volumes.
Scope 3 greenhouse gas emissions
Million metric tons of carbon dioxide equivalent
Reducing direct and indirect (scope 1 and 2) GHG emissions
Reducing GHG emissions from our own operations is our most direct and impactful means of contributing to the low carbon transition. Addressing our scope 1 and 2 emissions also helps establish PPG’s commitment to decarbonization and sets the stage for future partnerships to reduce GHG emissions across our value chain. To meet our 2030 goals, PPG partnered with NextEra Energy to develop a decarbonization roadmap to achieve a 50% GHG emissions reduction in our scope 1 and 2 emissions footprint by 2030. The roadmap includes PPG energy efficiency investments in our manufacturing facilities and increased use of renewable energy to replace our current sources of electrical energy supply. PPG's largest emissions sources come from the U.S. and Europe, representing 82% of our total 2023 emissions footprint. The key components of the renewable energy roadmap include on-site and off-site renewable energy installations and the purchase of renewable energy via power purchase agreements.
In 2023, the global engineering group identified PPG's largest energy saving opportunities at our global manufacturing sites and began installing energy monitors to better assess energy efficiency to identify opportunities to reduce usage at sites. We are taking a two-pronged approach to reducing energy use that includes process improvement and the adoption of new technologies such as combined heat and power units. In Europe, the five PPG facilities that use the most energy adopted rigorous energy management requirements in line with ISO 50001 standards to help systematize the identification of energy wasteful processes and drive down energy consumption.
As we identify the need to replace process and utility equipment that is inefficient and is at its useful life, we are upgrading and retrofitting to more energy efficient assets. In one example, our Oak Creek, Wisconsin, site replaced traditional incandescent and fluorescent light bulbs with energy efficient LEDs in 2023. The change will save approximately 4,400 MWhs annually. Initiatives such as this one support our goal to continuously improve energy efficiency and, as a direct result, reduce GHG emissions across our operations.
We also expanded our renewable energy sourcing efforts over the past year. In 2023, 31% of our purchased electricity was generated by renewable sources. Thus far, we have completed on-site solar installations at our Oak Creek, Wisconsin; Valencia, Spain; and Bucharest, Romania, sites. Many of our Texas sites and PPG Paints stores in Ohio have active power purchase agreements (PPAs). We continued to work with partners to evaluate onsite renewable opportunities and to secure renewable electricity through PPAs, which guarantee a renewable electricity supply for years into the future, while allowing us to lock in a fixed rate for electricity.
Lloyd's Register Quality Assurance provided limited assurance on our scope 1 and scope 2 GHG data. View the assurance report.Lloyd's Register Quality Assurance provided limited assurance on our scope 1 and scope 2 GHG data. View the assurance report.
Reducing emissions across our value chain (scope 3)
We recognize our ability to influence the reduction of GHG emissions that extend beyond the footprint of our own operations. For that reason, PPG is committed to collaborating with our customers and suppliers to advance their own GHG emissions reduction goals and limit our collective impact. In 2023, we announced the validation of our science-based targets by SBTi to reduce our absolute scope 3 emissions by 30% from a 2019 baseline by 2030. Our value chain emissions goal applies to three categories: purchased goods and services (category 1), processing of sold products (category 10), and end-of-life treatment of sold products (category 12). We have identified the primary levers of scope 3 reductions to be customer innovations that lower energy use, circular solutions, value chain energy transition and solvent emissions.
Category 1
Purchased goods and services
Category 10
Customer processing of sold products
Category 12
End-of-life treatment of sold products
Purchased goods and services
Our operations depend on the use of raw material inputs that generate GHG emissions from upstream production activities. In an effort to address these upstream impacts, we established a new global ESG procurement manager position in 2023, dedicated to supporting PPG’s supplier base through education and engagement. This new position collaborates with our global procurement team to engage suppliers in defining lower carbon feedstocks and raw materials, setting expectations for supplier GHG emissions reductions of their operations, aligned to our target of 30% by 2030, and tracking and monitoring supply chain due diligence activities.
In the last year, PPG initiated a process to monitor decarbonization performance of our largest suppliers in addition to monitoring other key environmental and social performance metrics. We constructed our scope 3 emissions footprint using industry average data and are actively assembling more accurate emissions data from our largest raw material suppliers. We will continue to gather the most accurate data available over time. We track scope 3 emissions related to our spending, follow emissions by supplier and region, evaluate supplier performance and put action plans in place. We also recognize the importance of developing strategic supplier relationships with partners who share our commitment to sustainability. In the past year, we engaged with our top 20 suppliers to lay out our expectations and discuss pathways for achieving traceable reductions to our scope 3 emissions. Once engaged, suppliers submit proposals for emissions reduction projects, not limited to direct greenhouse gas intensity reduction, which PPG reviews for feasibility and potential impact. We use an internal platform to intake supplier proposals, track progress across our supplier base and understand the sustainability benefits attributed to those specific projects. PPG is focused on evaluating alternative, lower carbon feedstocks and expanding knowledge of hot spots of process emissions up the value chain to determine where actions can be taken to meet our scope 3 emissions reduction target.
Beyond partnering with our suppliers and customers, we continue to embed circular economy principle across our operations. By limiting waste, reusing materials and extending product life cycles we are reducing both our value chain GHG emissions and raw material costs. Learn more in the supplier sustainability and waste sections.
Customer processing of sold products
In 2023, we modeled the emissions intensity of applying and curing different PPG products at our customer sites. With this information, we are partnering with customers to promote the use of existing products that require less energy to apply and cure and develop new products that improve this further. These efforts will reduce our customers' GHG emissions, reduce PPG's downstream scope 3 emissions and position PPG to better meet the opportunities resulting from climate change economic transitions. Learn more in the sustainability advantaged products section.
For PPG paints and coatings that require electricity in the application and curing processes, the emissions intensity of our sold products is also impacted by our customers' energy mix. We have already seen improvements in our downstream scope 3 emissions based on the greening of the energy grid, and expect to see continued organic reductions in our scope 3 emissions as the energy mix shifts to renewables. Our ability to work with our customers to advance less energy intensive curing approaches such as electron beam curing vs. UV curing will also have a favorable impact on lowering GHG emissions.
End-of-life treatment of sold products
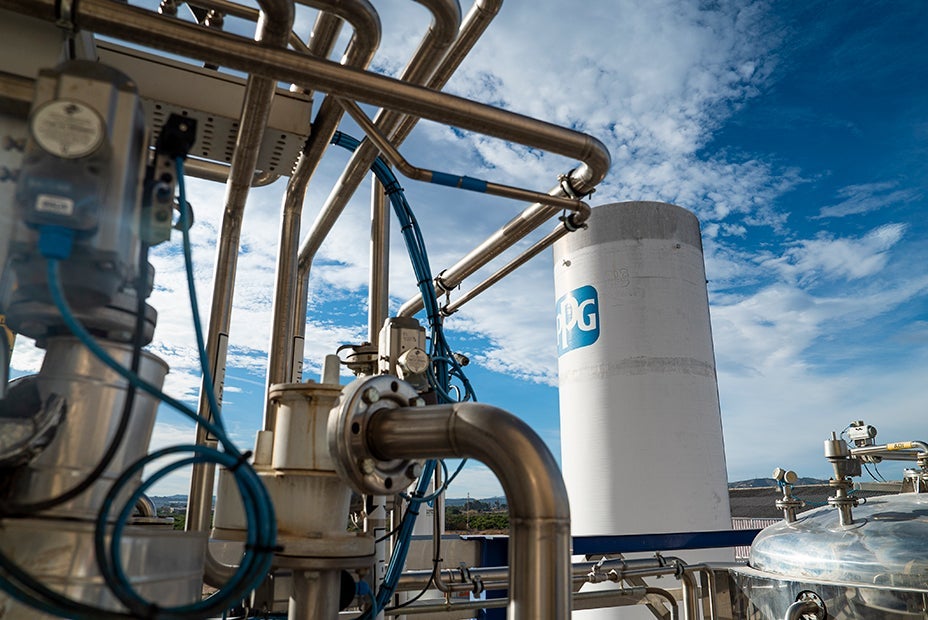
Downstream scope 3 GHG emissions associated with end-of-life treatment are largely a function of the chemical composition of our products. While the reformulation and removal of carbon intensive raw materials in formulations offers opportunities for significant GHG emissions reductions, we must continue to meet customer expectations and not compromise product performance including protective properties. In some of our product formulations, we have already started to replace fossil fuel derivatives with bio-based materials. Resins made from renewable resources such as sugars, natural oils, and starch from corn and agricultural waste offer more sustainable alternatives without compromising the quality and performance of the final product. By removing fossil fuel derivatives wherever possible, the end-of-life emissions of our products can be significantly reduced. Moving forward, we will continue to partner with our customers to develop and test new technologies that make our products more durable and limit end-of-life GHG emissions.
Other air emissions
While we do not report hazardous air pollutants (HAPs) on a global level, we do track those emissions at our U.S. facilities. In 2023, our U.S. operations emitted 252 metric tons of HAPs. As we reformulate products to enhance their environmental performance, our emissions of hazardous air pollutants should decrease over time. Learn more in the product stewardship section.
For more detailed information about our approach to reducing energy use across our operations, see below.
For more information about our ongoing approach to managing our GHG emissions, see below.
Multi-year data highlights
Greenhouse gas emissions
Million metric tons of carbon dioxide equivalents
| 2019 | 2020 | 2021 | 2022 | 2023 | |
| Total (scope 1 and 2) | 1.05 | 0.90 | 0.97 | 0.97 | 0.94 |
| Direct (scope 1) | 0.44 | 0.36 | 0.44 | 0.43 | 0.42 |
| Indirect (scope 2) | 0.62 | 0.54 | 0.53 | 0.54 | 0.53 |
| Value chain (scope 3)* | 21.04 | 19.59 | 20.42 | 19.7 | 18.54 |
Data changes from prior reporting reflect updated data and adjustments for acquired and divested locations from the 2019 baseline onward.
* Categories: purchased goods and services (category 1), processing of sold products (category 10), and end-of-life treatment of sold products (category 12).
Greenhouse gas emissions intensity
Metric tons of emissions per metric ton of production
| 2019 | 2020 | 2021 | 2022 | 2023 | |
| Direct (scope 1) | 0.10 | 0.08 | 0.10 | 0.10 | 0.11 |
| Indirect (scope 2) | 0.13 | 0.13 | 0.12 | 0.13 | 0.13 |
| Total | 0.23 | 0.21 | 0.22 | 0.23 | 0.24 |
Total intensity data include direct and indirect emissions. We report greenhouse gas as carbon dioxide equivalents for carbon dioxide, methane and nitrous oxide. Data changes from prior reporting reflect updated data and adjustments for acquired and divested locations from the 2019 baseline onward. Total may not equal the sum of direct and indirect due to rounding.
Air emissions
Metric tons
| 2019 | 2020 | 2021 | 2022 | 2023 | |
| Particulates | 269 | 325 | 291 | 302 | 176 |
| Volatile organic compounds | 2,673 | 1,909 | 3,908 | 1,983 | 3,117 |
| Nitrogen oxides | 1,178 | 996 | 938 | 1,572 | 706 |
| Sulfur dioxide | 76 | 59 | 53 | 48 | 55 |
Data changes from prior reporting reflect updated data and adjustments for acquired and divested locations.
Air emissions intensity
Metric tons of emissions per 1,000 metric tons of production
| 2019 | 2020 | 2021 | 2022 | 2023 | |
| Particulates | 0.06 | 0.08 | 0.07 | 0.07 | 0.14 |
| Volatile organic compounds | 0.58 | 0.45 | 0.89 | 0.47 | 0.81 |
| Nitrogen oxides | 0.26 | 0.23 | 0.21 | 0.38 | 0.56 |
| Sulfur dioxide | 0.02 | 0.01 | 0.01 | 0.01 | 0.02 |
Data changes from prior reporting reflect updated data and adjustments for acquired and divested locations.
Energy intensity
Gigajoules per metric ton of production
| 2019 | 2020 | 2021 | 2022 | 2023 | |
| Total | 2.93 | 2.58 | 2.91 | 3.04 | 3.15 |
| Direct | 1.69 | 1.46 | 1.74 | 1.78 | 1.81 |
| Indirect | 1.23 | 1.12 | 1.18 | 1.26 | 1.34 |
Total may not equal the sum due to rounding.
Energy intensity includes all types of energy consumed within the organization related to manufacturing and research and development.
Data changes from prior reporting reflect updated data and adjustments for acquired, divested and closed locations.
Energy consumption
Million gigajoules
| 2019 | 2020 | 2021 | 2022 | 2023 | |
| Direct | 7.75 | 6.26 | 7.63 | 7.45 | 7.13 |
| Indirect | 5.56 | 4.78 | 5.19 | 5.26 | 5.28 |
| Total | 13.40 | 11.03 | 12.82 | 12.71 | 12.41 |
Total may not equal the sum due to rounding.
Direct energy consumption is the amount of primary energy we combust onsite. Our direct energy sources may include coal, natural gas, fuel distilled from crude oil, propane, biofuels, ethanol and hydrogen. Indirect energy refers to the energy we consume that is generated by external suppliers. We consume indirect energy through electricity, heat, steam and electricity generated from renewable energy sources, such as solar and wind. Data changes from prior reporting reflect updated data and adjustments for acquired, divested and closed locations from the 2019 baseline onward.
Energy consumption by source
Million gigajoules/percent of total energy consumption
| 2019 | 2020 | 2021 | 2022 | 2023 | ||||||
| Source | Million gigajoules | Percent | Million gigajoules | Percent | Million gigajoules | Percent | Million gigajoules | Percent | Million gigajoules | Percent |
| Nonrenewable fuels purchased and consumed | 7.75 | 58% | 6.26 | 57% | 7.63 | 60% | 7.45 | 59% | 7.13 | 57% |
| Nonrenewable electricity purchased | 2.90 | 22% | 2.63 | 24% | 2.81 | 22% | 2.65 | 21% | 2.43 | 20% |
| Steam/heating/cooling and other nonrenewable energy purchased | 2.04 | 15% | 1.45 | 13% | 1.58 | 12% | 1.83 | 14% | 1.75 | 14% |
| Total renewable energy purchased or generated | 0.71 | 5% | 0.69 | 6% | 0.80 | 6% | 0.78 | 6% | 1.10 | 9% |
| Total non renewable energy sold | 0.00 | - | 0.00 | - | 0.00 | - | 0.00 | - | 0.00 | - |
| Total nonrenewable energy consumption | 12.69 | 95% | 10.34 | 94% | 12.02 | 94% | 11.93 | 94% | 11.31 | 91% |

