Water

Reduction in water intensity at priority sites in water scarce communities

We consider our impacts on the entire water basin, and take into account the local environmental, regulatory and socioeconomic context of each of our sites.
Our most significant impact on water availability in local communities comes from our facilities located in water stressed communities. When setting our 2030 water goal, we chose to prioritize water efficiency measures in areas with high water scarcity risk rather than reducing our overall water intensity.

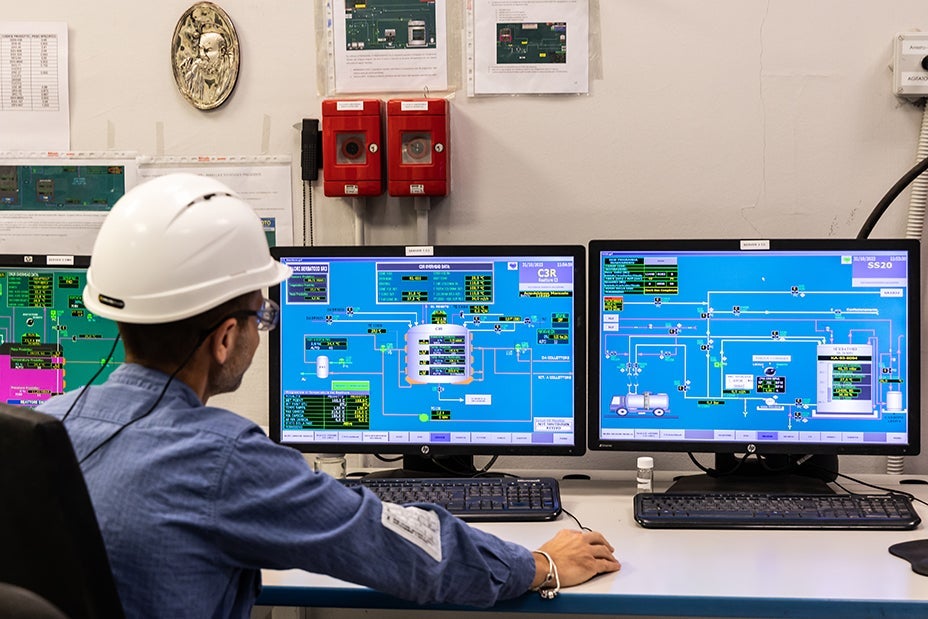
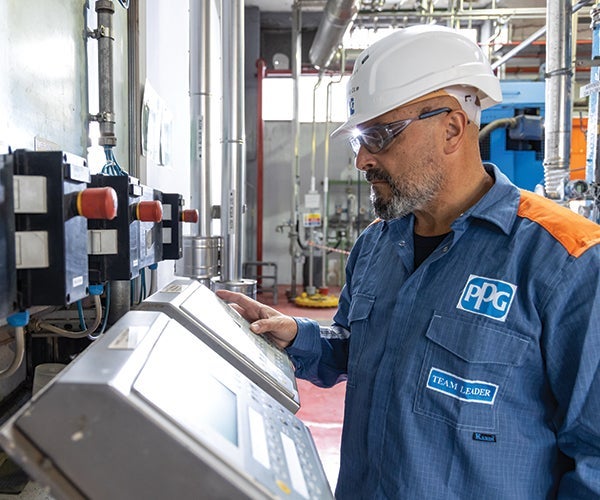
We focused our efforts in 2023 on 26 PPG facilities that were identified for high water use and proximity to water stressed regions. We invested in submeters to measure the water used for different production processes rather than relying on facility-level water meters. These submeters helped us to identify the most water-intensive production processes so we could develop strategies to reduce our usage. The detailed view of our water usage also helped identify water lines in need of repair or replacement, which helped reduce water waste.
Combined, these strategies have helped reduce the amount of water that we use in water stressed communities by 13% from a 2019 baseline. We are continuing to broaden our focus, evaluating more of our facilities in water stressed areas and building on our progress to date. Given our rapid progress toward meeting the 2030 goal, we are exploring the possibility of setting a more ambitious water reduction target in the future.
Zero Discharge Project
During our production processes, some paint gets left behind in the tanks and pipes we use to mix and package our products. We clean out the system with water to keep it running properly and avoid cross contamination between batches. Historically, we have sent pretreated wash water to a municipal water treatment facility to be further cleaned and then released back into the local water system. The Zero Discharge Project is an ongoing initiative which aims to reuse wash water and reduce raw material waste. In 2023 alone, we were able to reuse approximately 16 million pounds of water in our U.S. and Canada architectural coatings business, an increase of 615,000 pounds, or 4%, over the previous year.
Reuse of wash water may be limited by a range of factors, including local legislation that limits certain material use and physical constraints on the amount of water that can be stored for reuse at our production facilities. In 2023, we implemented an optimization process to consider these factors and expand the reuse of wash water and recovery of raw materials from the Zero Discharge Project. We expect that this process will enable us to reuse as much as 10% more water in 2024.
For more information about how we approach water use, see below.
Multi-year data highlights
Water intensity
Cubic meters per metric ton of production
Water intensity for priority sites in water stressed areas
Scroll right to view further data »
| 2023 | 2022 | 2021 | 2020 | 2019 |
| 1.09 | 1.38 | 1.30 | 1.30 | 1.26 |
Data changes from prior reporting reflect adjustments for acquired and divested locations from the 2019 baseline onward.
Water consumption - All sources
Million cubic meters
Scroll right to view further data »
| 2023 | 2022 | 2021 | 2020 | 2019 | |
| Withdrawn | 14.86 | 17.73 | 17.72 | 15.28 | 18.73 |
| Discharge | 12.39 | 14.64 | 14.38 | 13.29 | 13.87 |
| Net consumption (withdrawn minus discharge) | 2.47 | 3.09 | 3.35 | 1.99 | 4.86 |

