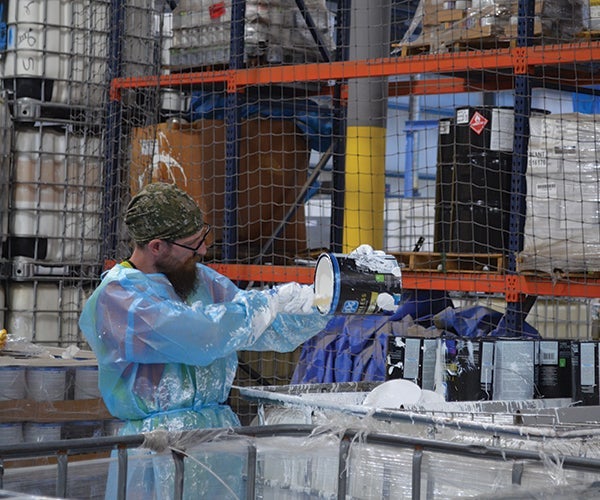
Waste
Beyond the environmental benefits, reducing waste and increasing resource efficiency helps lower our costs and supports our continued success. We consider circularity in our product design, use raw materials as efficiently as possible, minimize operational waste and promote reuse and recycling throughout our value chain.
Our waste intensity in 2023 increased by 7% compared to the 2019 baseline. 45% of process waste was either reused, recycled or recovered. While operating sites have continued to implement waste reduction measures, we expect that progress toward our waste goals will not be linear. Extensive cleaning and maintenance processes, which are completed at some of our larger facilities every 2-3 years, result in increased waste output and we expect variability in our waste intensity as a result.
Reduction of total waste intensity

Increase process waste to reuse, recycle and recovery

Annual improvement in spills and releases

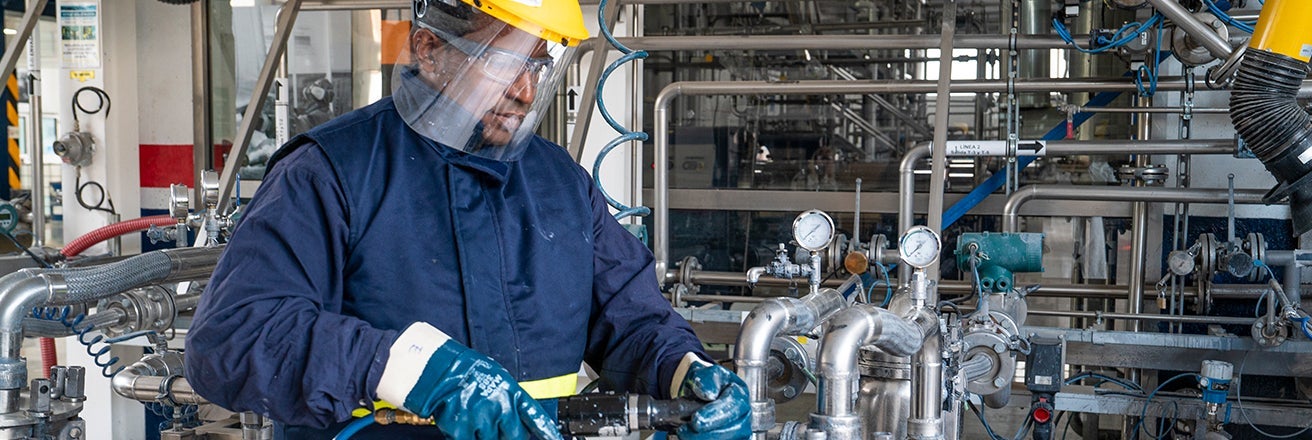
Reducing waste in our operations
When setting our 2030 targets, we changed our approach to measuring waste intensity to prioritize the reuse and repurposing of materials in our production processes. We now include any materials sent offsite for recycling in our waste intensity metric. This shift acknowledges that recycling is less efficient than waste elimination, repurposing and reuse and ensures that we're incentivizing desired behavior across our manufacturing and operations functions. Reusing materials that would have otherwise been recycled helps reduce our yield loss and ultimately improves profitability.
While we encourage reuse and repurposing where possible, we also recognize that recycling plays an important role in keeping waste out of landfills. Our goal to drive 100% of process waste to reuse, recycle and recovery supports continuous improvements in the percentage of our waste that is diverted from landfills and other disposal facilities.

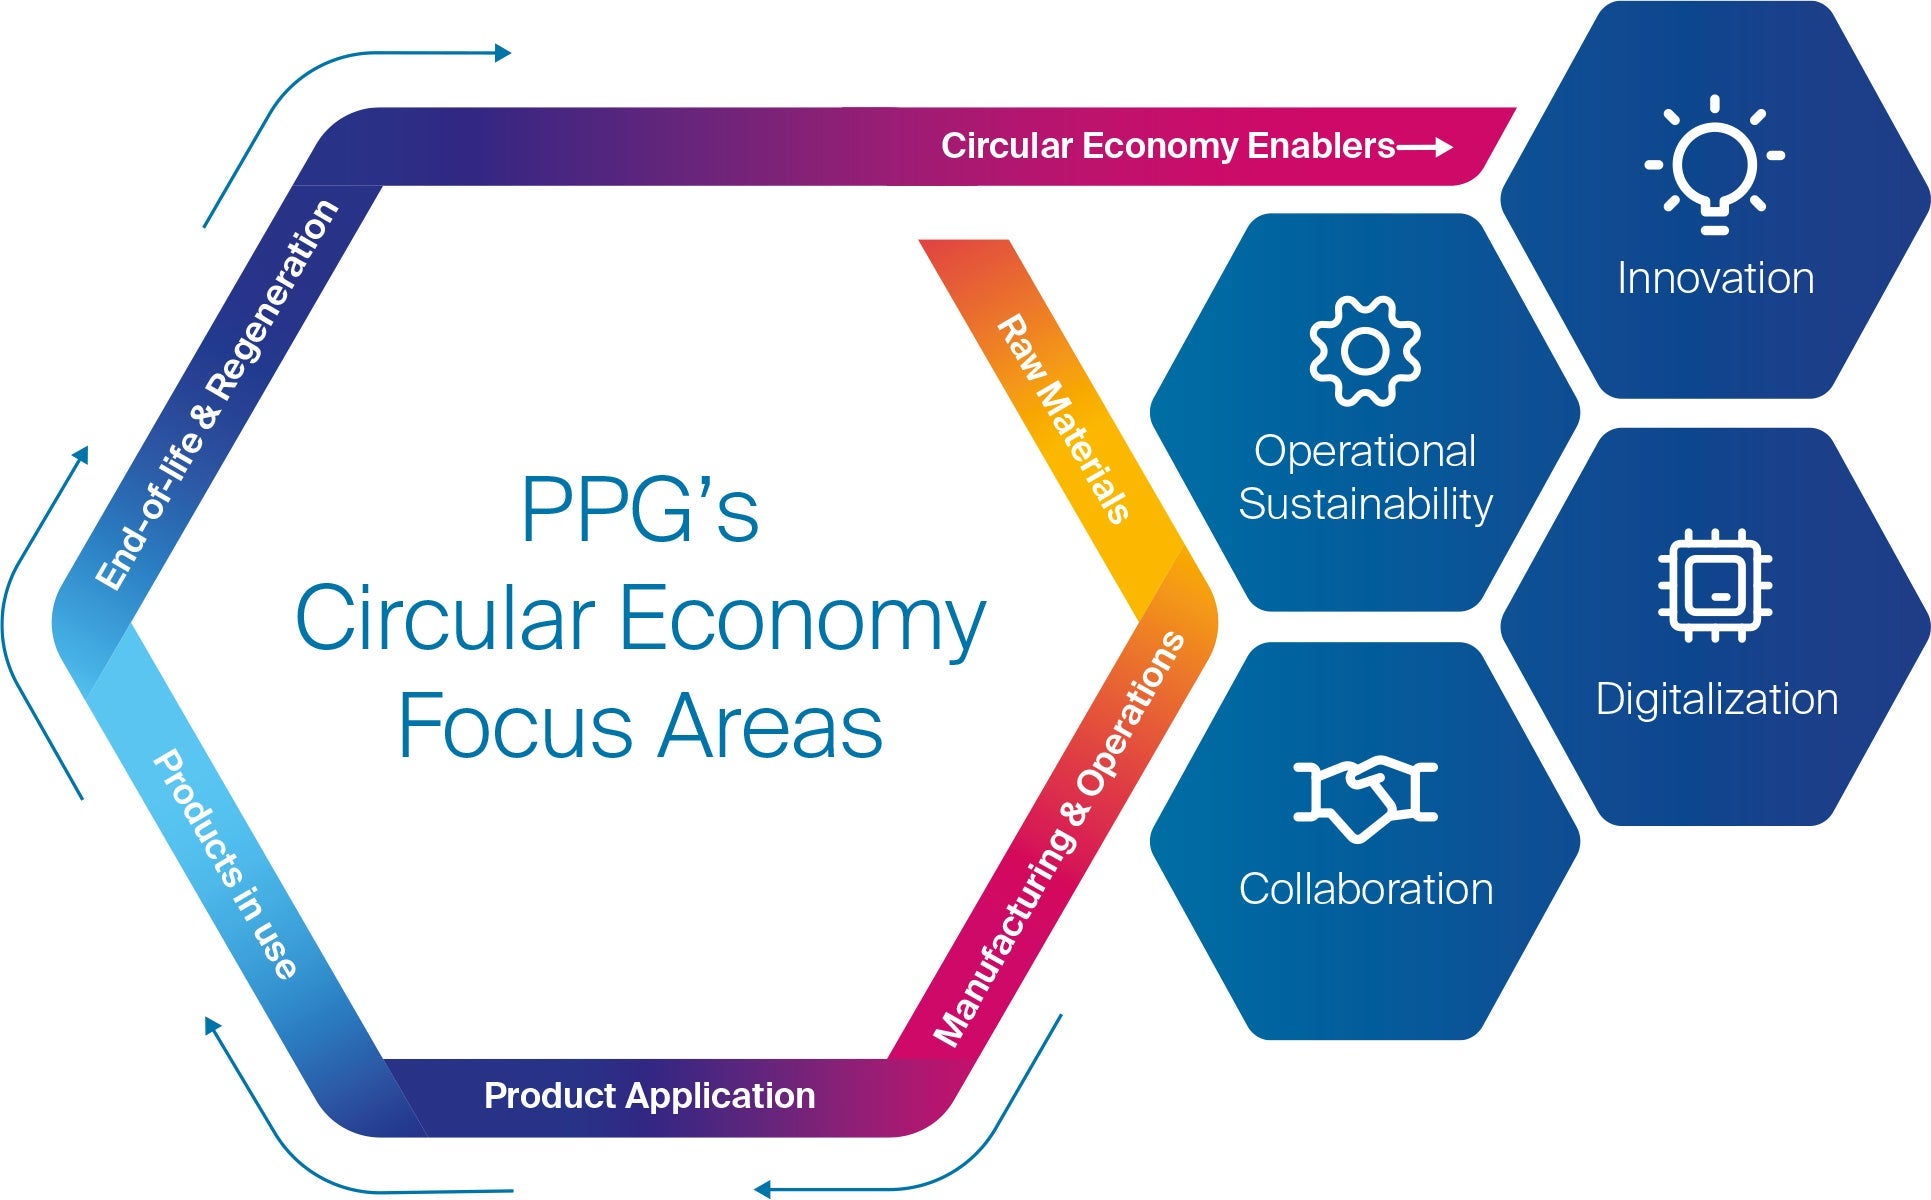
Advancing our circularity approach
PPG supports the circular economy by focusing on every stage of our products' life cycle. We reviewed opportunities to reduce waste from the sourcing of raw materials, through the manufacturing process, to the application and usage of products, and their end-of-life. Throughout 2023, we worked to formalize our circularity approach by understanding how PPG is already contributing to the circular economy and developing a formal circular economy strategy to guide future efforts.
As part of this operational review of our contributions to the circular economy, we identified a need for more granular waste data. We’re working with 25 PPG sites that generate the most waste, developing detailed waste inventories and using root cause analysis to identify opportunities to reduce sources of waste. This effort is aligned to our 2030 ambition to reduce our waste intensity by 25% vs. a 2019 baseline.
Spills and releases
The median spill in 2023 was 4,802 pounds, with 100% of spills contained onsite. We had six substantial spills during the year, which totaled 16,677 gallons (59,431 liters). Many of these spills have been attributed to issues with mechanical integrity or work instruction practices.
PPG facilities employ management practices to prevent spills and releases, including employee engagement activities, training, spill elimination assessments, operational improvements, self-assessments and best practice sharing.
To reduce the likelihood of spills and releases from mechanical integrity issues, PPG's operations team recently launched initiatives around the use of digital tools and maintenance standard work processes. Digital sensors and in-line monitoring tools are being implemented to predict equipment failure and address these prior to an incident. We are also standardizing maintenance processes across our sites. As part of these initiatives, our team is moving to more proactive maintenance practices. We are already seeing the benefits at locations that these initiatives have been implemented and continue to closely track our performance over time.
We are also engaging PPG employees by leveraging Job Safety Analysis (JSA), a systematic process designed to identify potential hazards and develop improved work practices for carrying out a specific task or job operation. This is one of several tools within our EHS Management System that help address causal factors, such as equipment, process, or people interactions, to prevent future occurrence of spills and releases.
For more information about how we approach waste management and circularity, see below.
Multi-year data highlights
Waste disposal
Thousand metric tons
Scroll right to view further data »
| 2023 | 2022 | 2021 | 2020 | 2019 | |
| Waste generated | 179.19 | 188.17 | 170.15 | 164.39 | 194.62 |
Total waste intensity metric tons per 100 metric tons of production | 4.55 | 4.50 | 3.84 | 3.84 | 4.25 |
| Disposed | 99.12 | 116.70 | 90.18 | 89.68 | 112.49 |
Disposal intensity metric tons per 100 metric tons of production | 2.52 | 2.79 | 2.05 | 2.10 | 2.46 |
| Waste Recycled | 80.07 | 71.47 | 79.97 | 74.71 | 82.13 |
Disposed waste does not include waste that is recycled, reclaimed or incinerated for energy recovery. Waste generated includes all waste from manufacturing and R&D locations generated as a consequence of the activities involved in the production of our products and services. Data changes from prior reporting reflect adjustments for acquired and divested locations.
Waste generated / recycled
Non-hazardous waste
Scroll right to view further data »
| 2023 | 2022 | 2021 | 2020 | 2019 | |
Generated thousand metric tons | 81.05 | 100.56 | 74.03 | 70.69 | 81.96 |
Recycled percent | 34% | 25% | 38% | 37% | 35% |
Disposed thousand metric tons | 53.29 | 75.30 | 46.26 | 44.40 | 52.90 |